Republic of the Philippines · Official website of the Provincial Government of Davao Oriental

Province ofDavao Oriental — home page
Digital Services

Menu

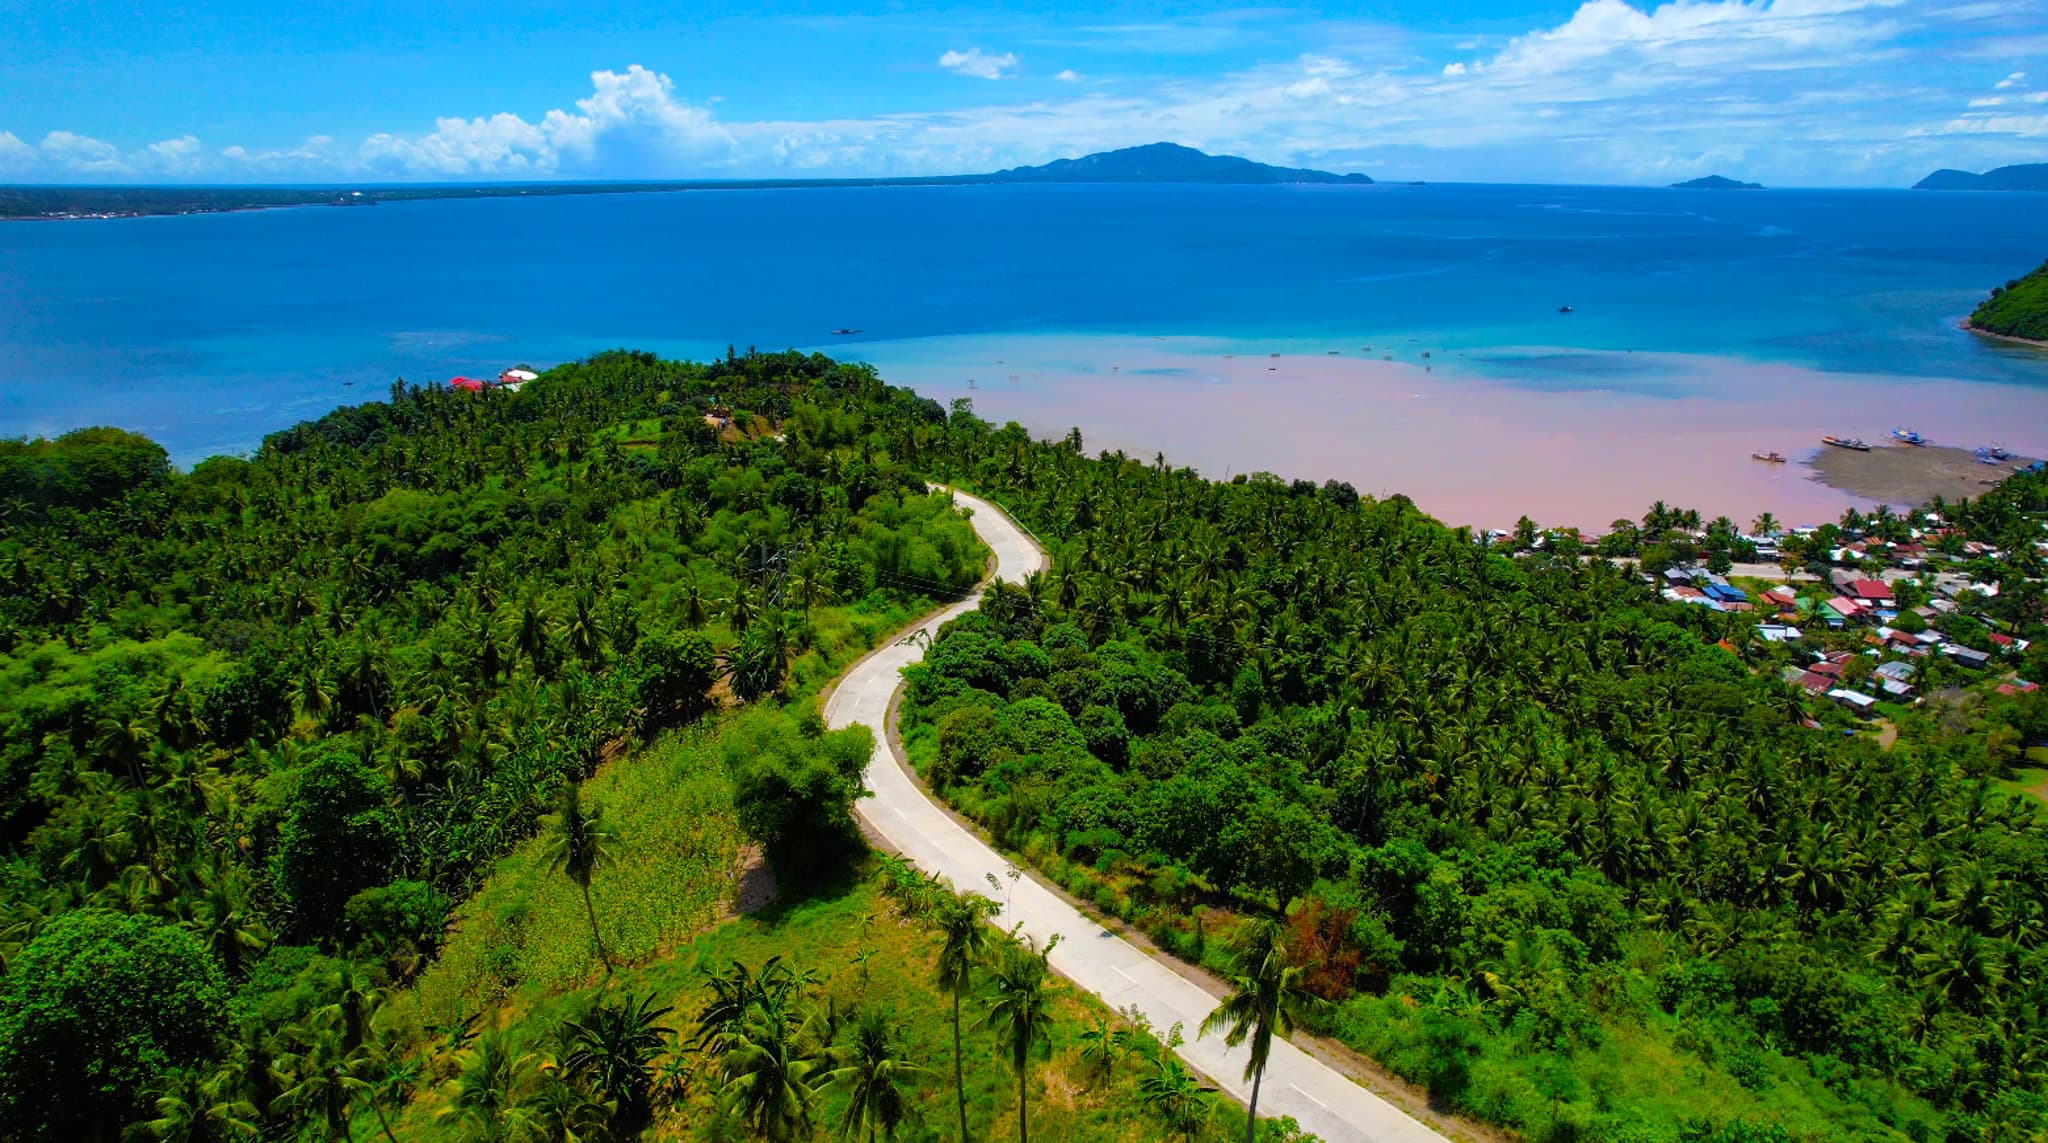
Aerial view of a concrete road winding over a hill covered in coconut palms towards a coastal village and a wide bay.

Development priority 03 of 10

Transportation

Roads and bridges that connect every community to opportunity.

Photo: Provincial Information Office, Provincial Government of Davao Oriental (photo: Eden Jhan Licayan) · Philippine government work (RA 8293 Sec. 176)

Overview

What the transportation priority covers

Public record · pending validation

Covers the provincial road network, bridges, road connectivity between barangays and growth centres, and the accessibility of public transport.

Data validated by
Provincial Planning and Development Office (PPDO)

Indicators with validated data

4 of 5

Monitored projects

4

2 ongoing · 1 completed

Approved budget of monitored projects

₱153.9M

Sum of the 4 of 4 projects that disclose an approved budget.

What is being done

Programs

  • [Demo] Provincial road network program

    Demonstration data

    Sample program entry under the Transportation priority, shown to demonstrate how programs are listed. It does not describe an actual provincial program.

    Implementing office: Provincial Engineer's Office

  • [Demo] Bridge program

    Demonstration data

    Sample program entry under the Transportation priority, shown to demonstrate how programs are listed. It does not describe an actual provincial program.

    Implementing office: Provincial Engineer's Office

  • Gateway Connectivity Program ("Three Provinces, One Gateway Corridor")

    Public record · pending validation

    An initiative backed by the provincial governments of Davao de Oro, Davao Oriental and Davao Occidental with MinDA, DTI and DOT to integrate air, land and sea infrastructure across the three provinces. The Governor of Davao Oriental voiced support. It is reported as a pledge of commitment.

    Implementing office: to be designated

What results

Transportation indicators

Each card shows the latest validated full-year figure up to 2025, its target, trend and breakdown by city and municipality.

Figures on this page are published only after validation by the Provincial Planning and Development Office. Targets are shown as planned figures; reports still awaiting validation are not shown. Physical accomplishment measures work done; financial accomplishment measures funds disbursed against the budget — the two are reported separately.

TRA-01ValidatedDemonstration dataHeadline indicator

Provincial roads improved

Definition: Length of provincial roads constructed, concreted or rehabilitated.

Validated actual · Annual 2025

40km

Against the 2025 target of 43 km93%
Unit of measurement
km
Baseline
Not yet established
Annual target, 2025
43 km
Actual accomplishment
40 km
Percentage accomplishment
93% of target
Reporting period
Annual 2025
Coverage
Added up from 11 of 11 cities and municipalities with validated reports
Data source
Demonstration data — not an official record
Last updated
Validation status
Validated by the PPDO

2026 so far: Q1 — 9.9 km validated (quarter target 11.7); Q2 — 10.1 km validated (quarter target 11.7). The 2026 annual target is 46.6 km (planned).

Trend: annual target and validated actual, 2021–2025

km

  • Actual (validated)
  • Target
02040602021202220232024202520262021 — Target: 30.92022 — Target: 33.72023 — Target: 36.52024 — Target: 39.72025 — Target: 432026 — Target: 46.646.62021 — Actual (validated): 28.82022 — Actual (validated): 312023 — Actual (validated): 34.42024 — Actual (validated): 35.92025 — Actual (validated): 4040

Validated actual: 28.8 km in 2021; 40 km in 2025.

View data as table
Provincial roads improved (km), Davao Oriental: annual target and validated actual
YearTargetActual (validated)Actual as % of targetValidation status
202130.928.893.2Validated by the PPDO
202233.73192Validated by the PPDO
202336.534.494.2Independently validated
202439.735.990.4Validated by the PPDO
2025434093Validated by the PPDO
2026 (Q1–Q2 only — not plotted)46.62042.9Validated by the PPDO
Download CSV
Breakdown by city and municipality, 2025
Provincial roads improved (km) by city and municipality, 2025. Listed alphabetically, not ranked.
City / municipalityTargetActual (validated)Actual as % of targetValidation status
Baganga2.82.8100Validated by the PPDO
Banaybanay2.32.191.3Validated by the PPDO
Boston3.83.592.1Validated by the PPDO
Caraga3.43.191.2Validated by the PPDO
Cateel3.93.897.4Validated by the PPDO
Governor Generoso2.22.2100Validated by the PPDO
Lupon44.2105Validated by the PPDO
Manay5.44.685.2Validated by the PPDO
City of Mati5.34.279.2Validated by the PPDO
San Isidro5.75.7100Validated by the PPDO
Tarragona4.23.890.5Validated by the PPDO
TRA-02ValidatedDemonstration dataHeadline indicator

Bridges constructed or rehabilitated

Definition: Bridges constructed, replaced or rehabilitated.

Validated actual · Annual 2025

56bridges

Against the 2025 target of 69 bridges81.2%
Unit of measurement
bridges
Baseline
Not yet established
Annual target, 2025
69 bridges
Actual accomplishment
56 bridges
Percentage accomplishment
81.2% of target
Reporting period
Annual 2025
Coverage
Added up from 10 of 11 cities and municipalities with validated reports
Data source
Demonstration data — not an official record
Last updated
Validation status
Validated by the PPDO

Trend: annual target and validated actual, 2021–2025

bridges

  • Actual (validated)
  • Target
0204060802021202220232024202520262021 — Target: 582022 — Target: 622023 — Target: 632024 — Target: 642025 — Target: 692026 — Target: 71712021 — Actual (validated): 542022 — Actual (validated): 592023 — Actual (validated): 602024 — Actual (validated): 602025 — Actual (validated): 5656

Validated actual: 54 bridges in 2021; 56 bridges in 2025.

View data as table
Bridges constructed or rehabilitated (bridges), Davao Oriental: annual target and validated actual
YearTargetActual (validated)Actual as % of targetValidation status
2021585493.1Validated by the PPDO
2022625995.2Validated by the PPDO
2023636095.2Validated by the PPDO
2024646093.8Validated by the PPDO
2025695681.2Validated by the PPDO
202671——Planned (target only)
Download CSV
Breakdown by city and municipality, 2025
Bridges constructed or rehabilitated (bridges) by city and municipality, 2025. Listed alphabetically, not ranked.
City / municipalityTargetActual (validated)Actual as % of targetValidation status
Baganga55100Validated by the PPDO
Banaybanay4375Validated by the PPDO
Boston6——No validated data
Caraga5480Validated by the PPDO
Cateel66100Validated by the PPDO
Governor Generoso44100Validated by the PPDO
Lupon6583.3Validated by the PPDO
Manay99100Validated by the PPDO
City of Mati8787.5Validated by the PPDO
San Isidro9777.8Validated by the PPDO
Tarragona7685.7Validated by the PPDO
TRA-03ValidatedDemonstration dataHeadline indicator

Road connectivity

Definition: Share of barangays connected to the road network by all-weather roads.

Validated actual · Annual 2025

83.1%

Against the 2025 target of 86.1%96.5%
Unit of measurement
%
Baseline
Not yet established
Annual target, 2025
86.1%
Actual accomplishment
83.1%
Percentage accomplishment
96.5% of target
Reporting period
Annual 2025
Coverage
Added up from 11 of 11 cities and municipalities with validated reports
Data source
Demonstration data — not an official record
Last updated
Validation status
Validated by the PPDO

Trend: annual target and validated actual, 2021–2025

%

  • Actual (validated)
  • Target
02550751002021202220232024202520262021 — Target: 71%2022 — Target: 73.1%2023 — Target: 79.3%2024 — Target: 81.4%2025 — Target: 86.1%2026 — Target: 91.3%91.3%2021 — Actual (validated): 63.7%2022 — Actual (validated): 65.6%2023 — Actual (validated): 72.7%2024 — Actual (validated): 75.5%2025 — Actual (validated): 83.1%83.1%

Validated actual: 63.7% in 2021; 83.1% in 2025.

View data as table
Road connectivity (%), Davao Oriental: annual target and validated actual
YearTargetActual (validated)Actual as % of targetValidation status
202171.0463.6589.6Validated by the PPDO
202273.1365.6289.7Validated by the PPDO
202379.2772.7391.7Validated by the PPDO
202481.3675.4692.7Validated by the PPDO
202586.183.0696.5Validated by the PPDO
202691.3——Planned (target only)
Download CSV
Breakdown by city and municipality, 2025
Road connectivity (%) by city and municipality, 2025. Listed alphabetically, not ranked.
City / municipalityTargetActual (validated)Actual as % of targetValidation status
Baganga84.386.4102.5Validated by the PPDO
Banaybanay86.983.195.6Validated by the PPDO
Boston79.582.2103.4Validated by the PPDO
Caraga89.984.594Validated by the PPDO
Cateel84.486.5102.5Validated by the PPDO
Governor Generoso95.192.497.2Validated by the PPDO
Lupon95.286.590.9Validated by the PPDO
Manay88.683.994.7Validated by the PPDO
City of Mati78.868.887.3Validated by the PPDO
San Isidro84.273.787.5Validated by the PPDO
Tarragona80.285.7106.9Validated by the PPDO
TRA-04ValidatedDemonstration data

Transport accessibility

Definition: Barangays with regular public transport service.

Validated actual · Annual 2025

142barangays

Against the 2025 target of 165 barangays86.1%
Unit of measurement
barangays
Baseline
Not yet established
Annual target, 2025
165 barangays
Actual accomplishment
142 barangays
Percentage accomplishment
86.1% of target
Reporting period
Annual 2025
Coverage
Province-wide figure
Data source
Demonstration data — not an official record
Last updated
Validation status
Validated by the PPDO

Trend: annual target and validated actual, 2021–2025

barangays

  • Actual (validated)
  • Target
0501001502002021202220232024202520262021 — Target: 1182022 — Target: 1292023 — Target: 1402024 — Target: 1522025 — Target: 1652026 — Target: 1791792021 — Actual (validated): 1112022 — Actual (validated): 1292023 — Actual (validated): 1272024 — Actual (validated): 1522025 — Actual (validated): 142142

Validated actual: 111 barangays in 2021; 142 barangays in 2025.

View data as table
Transport accessibility (barangays), Davao Oriental: annual target and validated actual
YearTargetActual (validated)Actual as % of targetValidation status
202111811194.1Validated by the PPDO
2022129129100Validated by the PPDO
202314012790.7Validated by the PPDO
2024152152100Validated by the PPDO
202516514286.1Validated by the PPDO
2026179——Planned (target only)
Download CSV
Breakdown by city and municipality, 2025

This indicator is reported as a single province-wide figure for 2025; no validated city or municipal breakdown has been published.

TRA-05No validated data yet

Transport infrastructure investment

Definition: Appropriations obligated for road and bridge projects.

No validated data published yet — to be reported by Provincial Engineer's Office, validated by PPDO.
Unit of measurement
PHP
Baseline
Not yet established
Annual target
No target published yet
Actual accomplishment
No validated data yet
Percentage accomplishment
—
Reporting period
None yet
Coverage
Davao Oriental
Data source
To be stated by the responsible office
Last updated
—
Validation status
No validated data yet

Where it is happening

Transportation projects

Transportation projects by implementation status

Number of projects

Planned: 1 (25%)1Ongoing: 2 (50%)2Completed: 1 (25%)1
  • Planned1
  • Under procurement0
  • Ongoing2
  • Completed1
  • Suspended0
  • Terminated0

1 planned, 2 ongoing, 1 completed — 4 in all.

View data as table
Transportation projects by implementation status
Implementation statusProjects
Planned1
Under procurement0
Ongoing2
Completed1
Suspended0
Terminated0
Download CSV

Most recently monitored

Related

News and documents

News

Documents